Temporal nutrition analysis associates dietary regularity and quality with gut microbiome diversity: insights from the Food & You digital cohort
Diet quality and regularity influence gut alpha diversity
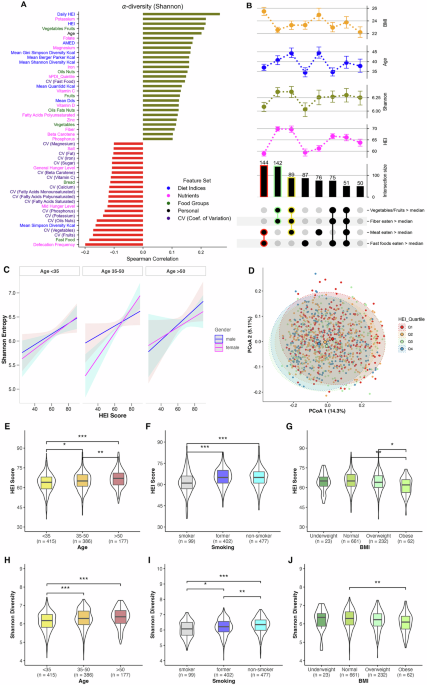
Alpha diversity, i.e., within sample diversity of microbial species, has previously been shown to be linked to dietary differences, particularly in terms of diet quality and fiber intake3,11. In our study, we derived two HEI-2020 measures for each participant: “HEI”, a single score calculated from the average daily intake of each food group across all tracking days, and “daily HEI”, the mean of HEI scores computed separately for each day, as a modified metric to capture day-to-day regularity in dietary quality. Our data exhibit the general expected trends as shown in Fig. 1A. Shannon entropy16, a measure of microbial diversity within a sample, was observed to be positively correlated to HEI (Spearman r = 0.22), even more strongly to the daily HEI metric (Spearman r = 0.27), and to the consumption of fiber (g/day), vegetables-fruit content (g/day) and micronutrients such as potassium (mg/day), magnesium (mg/day), folate (µg/day) and iron (mg/day) (Fig. 1A). Similar correlation patterns were observed across other alpha diversity metrics including Pielou’s evenness, Faith’s PD, and observed features (Supplementary Fig. 1B). Conversely, unhealthy diet intakes such as fast foods (g/day) and salt (g/day) content displayed negative correlation to microbial alpha diversity (Fig. 1A). We also observed a positive correlation with age, with significant differences in diet quality and alpha diversity between younger and older age groups (Fig. 1E, H).

A Highlights correlations of different physiological and dietary factors with Shannon diversity. B The top section display point plots showing the mean values and variability of Shannon microbiome diversity, HEI, BMI, and age across different subsets of the population categorized based on their dietary habits: consumption of vegetables/fruits, fiber, meat, and fast foods relative to the median. Each dietary habit category is indicated with black dots for presence above the median. The numbers above each bar indicate the number of unique participants (n) in each dietary subset. Error bars in point plots represent the standard error of the mean. Notable subsets are additionally highlighted with a color outline, such as red for higher-than-median meat and fast food intake. C Represents the relationship between HEI scores and Shannon entropy across age groups and gender, as estimated by a multiple regression model adjusted for BMI, smoking, eaten quantity, general hunger level, and daily defecation frequency. Lines indicate the model-predicted mean values, with shaded areas representing 95% confidence intervals. D Principal Coordinates Analysis of beta diversity (unweighted Unifrac distances) and the variance explained by first two principal coordinates. Boxplots (E–J) highlight significant differences across age, BMI, and smoking with respect to HEI and Shannon alpha diversity. One-way ANOVA with post-hoc pairwise t-tests was used to assess differences in HEI scores (E–G), while Kruskal–Wallis tests with post-hoc Wilcoxon rank-sum tests were employed for Shannon diversity comparisons (H–J). Boxplots display the median (line), interquartile range (box) and whiskers extending to 1.5× IQR. All p-values were adjusted using the False Discovery Rate (FDR) method. Significance levels are denoted as * <0.05, ** <0.01, and *** <0.001. Abbreviations:- HEI Healthy Eating Index-2020, CV coefficient of variation.
Analysis of participants grouped by median intakes of different food groups (g/day) revealed distinct patterns (Fig. 1B). Participants with above-median consumption of vegetables-fruits and fibers (n = 142) showed higher HEI diet quality, higher Shannon diversity, and lower BMI. In contrast, those with higher-than-median meat and fast food intake (n = 144) exhibited low HEI and Shannon diversity, with significantly higher BMI. Notably, participants consuming above-median levels of vegetables-fruits, meat, and fibers (n = 89) showed the highest Shannon diversity, along with very high HEI scores, older age, and lower BMI. Those with high fast food consumption alone (n = 87) demonstrated low HEI scores and Shannon diversity, and were predominantly younger.
Multiple regression analysis incorporating potential interactions revealed that HEI significantly predicted Shannon entropy (β = 0.011, p = 0.035, 95% CI [0.0008, 0.0213]) independent of age and gender, while accounting for confounding factors i.e., BMI, food quantity consumed (in g), hunger levels, and daily defecation frequency (for further details see Supplementary Table 2). The relationship between HEI and Shannon entropy remained consistent across age groups and genders (Fig. 1C). Notably, the regression model also revealed that BMI significantly influenced microbial diversity, where individuals with obesity (β = –0.1891, p = 0.005, 95% CI [–0.3208, –0.0528]) and individuals who are overweight (β = −0.10, p = 0.011, 95% CI [–0.1924, –0.0364]) both showed lower Shannon entropy compared to those with normal BMI. Additionally, it also indicated daily defecation frequency (β = −0.137, p < 0.001, 95% CI [–0.1833, –0.0929]) to be significantly negatively associated with microbial diversity. Furthermore, smoking status emerged as a significant factor, with both current smokers (β = –0.1210, p = 0.0004, 95% CI [–0.2888, –0.0692]) and former smokers (β = –0.1789, p = 0.0016, 95% CI [–0.1876, –0.0544]) showing reduced microbial diversity compared to non-smokers, while simultaneously having poor HEI (Fig. 1F, I).
Moreover, when we fit a model using daily HEI instead of the regular HEI score (with age and BMI as continuous variables and without any interaction terms), daily HEI remained a highly significant predictor of Shannon entropy (β = 0.019, p < 0.001, 95% CI [0.0141, 0.0242])) (Supplementary Table 3), reflecting an even stronger effect than the standard HEI coefficient would have shown in that same model (β = 0.013, p < 0.001, 95% CI [0.0085, 0.0179]).
Since the real-time tracking via the MyFoodRepo app allowed us to collect temporal diet data across multiple days, we were able to also calculate a metric that allows us to assess the temporal variability of consumption of different dietary components across participant’s tracking days. This variability is expressed in terms of the CV, wherein higher values indicate higher irregularity of consumption. In Fig. 1A, we can see that the CV of different dietary features, such as fruits, vegetables, oil-nuts, mono- and poly-unsaturated fats as well as the aforementioned micronutrients were negatively correlated with gut microbiota diversity. Moreover, the absolute value of the correlation of these features were often higher for their variability than for their respective consumption quantities, e.g, CVfruits showed a Spearman correlation of r = −0.18, while fruits eaten showed r = 0.12. This indicates that high variability in consumption of these food groups can also be used as a metric, perhaps as a better metric for certain dietary features, to measure the impact of diet on Shannon diversity. This relationship between CV and gut Shannon diversity persisted even when controlling for total consumption amounts through stratified analyses (see Supplementary Section for detailed validation).
Additionally, we examined the extent of variance explained by dietary variables on the Shannon alpha diversity using multivariate regression models (Supplementary Fig. 1). We observed that the variance explained by macronutrients only (i.e., carbohydrates, protein, fat, fiber, alcohol) was about 5% while micronutrients explained a larger part of the variance, nearly 10%. Collectively, micronutrients, macronutrients, diet indices and food groups explained nearly 20% of the variance in the alpha diversity. Previous studies have suggested that diet accounts for approximately 5%–20% of the variance in the microbiome composition17. Correspondingly, principal coordinate analysis on the unweighted UniFrac distances (i.e., a distance metric to measure between sample based on phylogeny, i.e., beta diversity) revealed that about 20% of the variance were explained by the first two principal coordinates (shown in Fig. 1D), although cluster segregations were not very distinct based on either HEI quartiles. Although, considering two extremes of HEI quartiles (Q1 and Q4), the highest HEI quartile (Q4) was characterized by markedly higher consumption of vegetables and fruits. In contrast, the lowest HEI quartile (Q1) exhibited high consumption of fast foods and sweets+salty snacks+alcohol food groups (Supplementary Fig. 1C).
Effect size of variables on microbial diversities
Furthermore, using the evident package18, we computed the effect sizes (Cohen’s f for multi-category variables and Cohen’s d for binary variables) of different demographic and dietary features on different alpha diversities and unweighted UniFrac beta diversity, shown in Supplementary Fig. 2. Language, past antibiotics usage and microbiome sequencing batch showed large effect sizes on alpha diversities. In the case of Shannon diversity, HEI had a strong impact. Pairwise effect sizes were also computed on features that were already binary or by sub-setting the data to two extremes groups, typically representing the top and bottom quartiles within features that were not binary. In pairwise case, HEI Quartiles (Q1 vs Q4), age group (18–35 vs 65 + ), hPDI Quintiles and BMI categories (i.e., Normal vs Obese) showed large effect sizes. In the beta diversity metric, however, only the past antibiotics treatment and menopausal state had a large effect.
Microbial correlations with dietary features
Furthermore, to investigate which microbial species correlate well with the different food groups and macronutrients, we performed partial correlation analysis, keeping age and BMI as covariates (Fig. 2A). Most microbes that were positively correlated to HEI, also correlated well with fiber, vegetables, fruits and nuts content and micronutrients like potassium, and these microbes were predominantly from the taxonomic order Lachnospirales. Figure 2A shows several of these taxa, notably Lachnospira (ASVs 55, 137), Eubacterium (ASVs 73, 222), Brotaphodocola (ASV 25), Alitiscatomonas (ASV 74), and Muricoprocola (ASV 228), etc. A few of the taxa with high correlations with HEI were also linked to producers of SCFAs production, e.g., ASV 73 and 137. This makes sense, as fiber-rich diets increase SCFA production in the gut, primarily associated with butyrate-producing bacteria. These bacteria contribute to healthier outcomes due to the predominantly beneficial role of SCFAs. Interestingly, several non-Lachnospirales bacteria also correlated with HEI and related food features. These included ASVs from order Oscillospiralles, like ASV 51 (Dysosmobacter), and from Christensenellales (ASV 100). Many taxa belonging to genus such as Mediterraneibacter (ASV 136) Lawsonibacter (ASV 134) were linked to higher meat consumption. While many other taxa showed positive correlation to fast food consumption and CV variables like CVoil-nuts and CVFruits and were also negatively correlated with fiber and HEI index. These included taxa like ASV 386 (genus Negativibacillus), ASV 380 (genus Merdibacter), ASV 370 (genus Acutalibacter) and ASV 360 (genus Thomasclavelia), and many other ASVs from different taxonomic order like Actinomycetales, Eryspilatotrichales, Lactobacillales, etc.
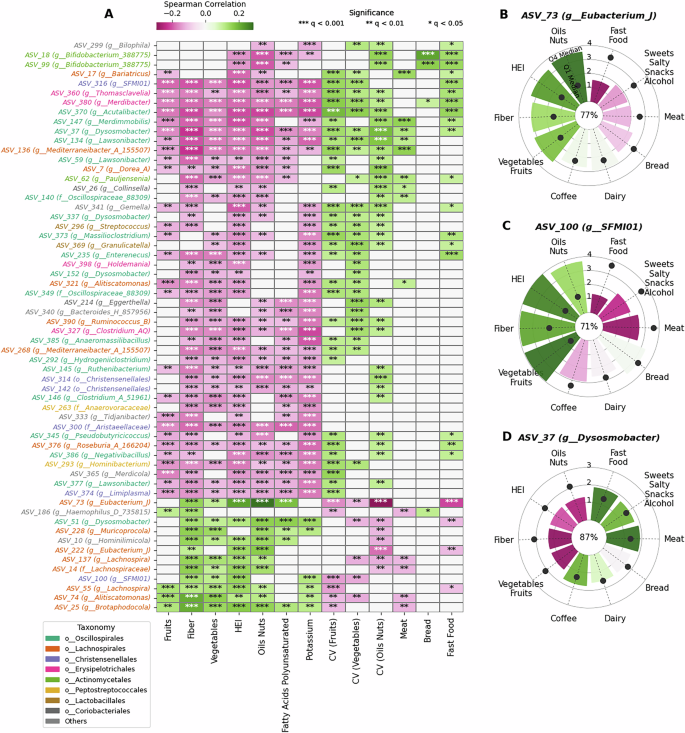
A Partial Spearman correlation of significant microbes across different diet features. The significance of the correlation is indicated by a dot in each cell, which contains the adjusted p-values (FDR Bonferroni Hochberg correction). B–D Show radial plots highlighting the median CLR (Centered Log Ratio) of different microbes in the top (Q4) and bottom (Q1) quartiles of different food groups and the correlation with the respective food group. The radial bars show the Q4 median CLR abundance and the black dot corresponds to the Q1 median CLR abundance. The prevalence percentage of the microbe is shown in the center of the plot.
ASV 73 (genus Eubacterium_J), prevalent in ~80% microbiome samples, was strongly associated with healthy eating intake, as it correlated with HEI, fiber, oil-nuts-seeds, vegetables and fruits. Here again, when comparing the top and bottom quartiles (Q4 and Q1, respectively) of HEI across individuals, we see a large difference where its median CLR abundance in the top quartile was much higher than its median CLR abundance in the bottom quartiles of these food groups (Fig. 2B). In the cases of meat, fast food, sweets+salty-snacks+alcohol and bread food groups, the median CLR abundance in the Q4 (top) quartiles of these food groups was lower than that of respective bottom quartiles. Another ASV with significant presence in people consuming higher quantities of these healthier food groups was ASV 100, while its presence was very low in people who consume more meat or fast foods (Fig. 2C). However, contrasting correlations were seen in the case of ASV 37 (genus Dysosmobacter), which had higher correlation with respect to meat consumption, and irregular consumptions of vegetables, fruits, oil-nuts. Its prevalence was ~90%, with its median CLR abundance in the Q1 quartile higher for healthier food groups (Fig. 2D). This indicates that these bacteria are common in poor diets, while they are less abundant in individuals consuming more vegetarian or healthier diets. Studies have indicated these bacteria to be linked to positive health outcomes in mice19. However, in our cohort, they correlated negatively with the HEI index.
Differential taxa and log-ratio associations with diet
We computed log ratios from the differentially abundant taxa (top 100), identified using BIRDMAn, across nutritional variables. Correlations of log ratios show strong complementarity with their respective nutritional variables and other related variables, while contrasting patterns are seen with variables that are negatively associated with the corresponding nutritional variable, as depicted in Fig. 3E. For instance, log ratio for HEI (Log RatioHEI) is strongly positively related to HEI (r = 0.42, p < 1e-50) while the same log ratio is inversely related to fast food consumption (r = −0.27, p < 1e-16), as shown in Fig. 3A, B. Similarly, dietary irregularity variables, i.e., CV, are inversely correlated to log ratios for various foods, like vegetables-fruits group, oil-nuts, fiber consumption and HEI (Fig. 3E). Comparing log ratio associations with other geographical cohorts20 reveal similar patterns (Supplementary Fig. 1D, E). For example, microbial log ratios showed positive correlations with HEI across multiple countries, including the US (r = 0.26), UK (r = 0.11), and Mexico (r = 0.097). This was further supported by positive associations with fiber intake (r = 0.4, p < 2e-39 in the “Food & You” cohort) that was also found in other populations (US: r = 0.28, UK: r = 0.2, Mexico: r = 0.12).
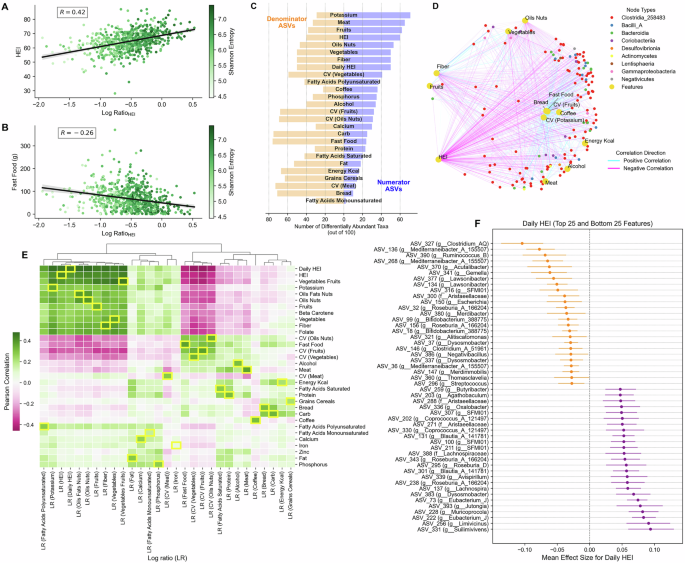
Scatterplots in A, B highlight the Pearson correlation between the log ratio of HEI and either HEI or fast food intake. Each point represents a unique participant, colored by Shannon entropy. Black lines show the linear regression fit; shaded bands indicate 95% confidence intervals for the mean prediction. C Highlights the number of differentially abundant taxa (max 100, grouped as numerator ASVs and denominator ASVs) across different dietary features. Credible ASVs with positive mean effect sizes form numerator ASVs, while negative ones form denominator ASVs. Collectively, their abundances are used for computing log ratios. D Bipartite network visualization of correlations between dietary features and gut microbiome taxa at the class level. Yellow nodes represent dietary variable,s including food groups, HEI, and dietary variability (CV). Colored nodes represent different bacterial classes, with node colors corresponding to taxonomic classification. Edge colors indicate correlation direction (cyan: positive, magenta: negative), and edge thickness represents correlation strength. E Heatmap showing the correlations of log ratios of various dietary features to all other dietary features, wherein the correlations of the corresponding features are highlighted in yellow outline. F Shows the top 25 positively (purple) and bottom 25 negatively (orange) associated ASVs for daily HEI identified using BIRDMAn. Points indicate the mean effect size for each taxon; error bars represent the 95% highest density interval (HDI) for each taxon’s association with HEI scores. Only taxa with credible intervals not crossing zero are shown.
Figure 3D highlights associations between dietary components and differentially abundant gut microbial taxa at the class taxonomic level. The dietary components analyzed included HEI, fiber, fruits, vegetables, energy intake (kcal/day), food groups including meat, fast food, bread, coffee, and alcohol; CV for fruits and potassium. The gut bacterial community in the network was predominantly represented by Clostridia. Healthy dietary components (e.g., HEI, fiber, fruits, and vegetables) exhibited similar correlation patterns, showing positive associations (cyan edges) with certain bacterial taxa and negative associations (magenta edges) with others. HEI emerged as a key factor with numerous connections, reflecting its strong association with microbiome composition among differentially abundant taxa.
BIRDMAn analysis identified several taxa with strong positive and negative associations with daily HEI score (Fig. 3F). Among the taxa showing decreased log mean-abundance with increasing daily HEI scores, multiple taxa from the genus Mediterraneibacter (ASV 136, 268, and 36) showed negative associations, along with members of Dysosmosisbacter (ASV 37 and 337) and Lawsonibacter (ASV 377 and 134). These taxa exhibited lower abundance in individuals with higher scores. Conversely, taxa showing positive associations included several members of the Lachnospiraceae family and multiple taxa from the genera Eubacterium_J (ASV 222 and 73), Butyribacter (ASV 259) and Coprococcus_A_121497 (ASVs 330, 202) were among the taxa most positively associated with daily HEI, potentially indicating their preference for dietary patterns associated with higher scores. Interestingly, Roseburia_A_166204 had taxa that were both negatively (ASV 32 and 156) and positively (ASV 343 and 238) differentially abundant. Differential abundance analyses were similarly performed for other dietary variables (Supplementary Fig. 4).
Bidirectional prediction between diet and microbiota
Given previously reported associations of diet and lifestyle with health outcomes, we further inspected whether in our data, machine learning models could predict dietary and lifestyle factors using only the microbiota as feature inputs. We examined the distinguishability between extreme quartiles (Q1 vs Q4) for dietary features as a classification task using XGBoost classifier models. Figure 4A and Supplementary Fig. 3C show that consumptions of the food groups vegetable-fruit and coffee, as well as daily HEI regularity, are strongly predictable with AUROC and AUPRC values around 0.9. Similarly, we can also observe this predictive power for consumptions of fiber and the food group oil-nuts, as well as standard HEI diet index, which all show AUROC and AUPRC values around 0.85–0.9 (Fig. 4A and Supplementary Fig. 3C). Further, CVoils-nuts, meat consumption, folate intake, fast food intake, grains-potatoes-pulses, vitamin C, and Dietary Approaches to Stop Hypertension (DASH) diet index were also strongly predictable, with ROC AUC values around 0.75–0.85. Age groups (18–35 and >50 years), BMI categories (normal vs obese) and linguistic regions of Switzerland (German vs Latin) were also predictable from microbiota features.
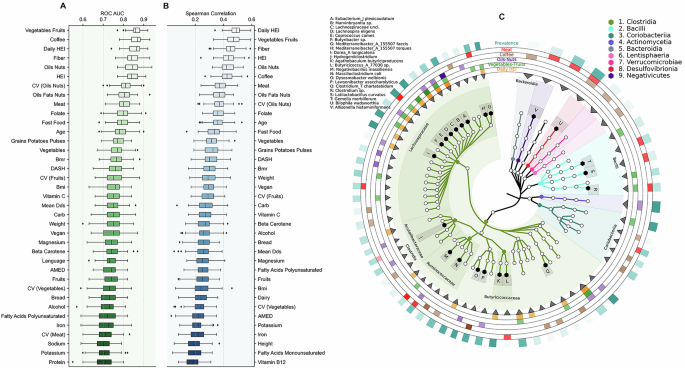
A Shows the classifier performances (ROC AUC) on predicting the extreme quartiles (Q1 and Q4) of different physiological and dietary features using only the microbiome data (n = 489). B Shows the regressor performances (Spearman correlations) on predicting the values of different physiological and dietary features using only the microbiota data (n = 978). Each boxplot summarizes 100 independent train-test splits (80:20), with each point corresponding to a unique test set. Boxplots display the median (line), interquartile range (box) and whiskers extending to 1.5× IQR. C Represents a phylogenetic tree highlighting the key microbial taxa that had the highest feature importance in different dietary classifiers (for daily HEI, vegetables-fruits, oil-nuts, coffee, and meat). Color intensity of the rings correspond to feature importance, except for the outer ring, which corresponds to the prevalence of the corresponding bacteria.
We then examined the regressor model performance using the entire dataset, not just the extreme quartiles used for the classifiers. The patterns observed in the regressor models closely mirror those seen in the classifier results (Fig. 4B). Specifically, the daily HEI and vegetable-fruit consumption show the highest Spearman correlation values, nearing 0.5. Of note, however, the predictive power of CVfruits was higher than that of fruits consumed, both in the case of classifier and regressor models. The same pattern is observed for the daily HEI and the standard HEI diet index, where the regularity metric outperforms the standard metric. We also reversed the prediction direction to classify extreme quartiles of alpha diversity metrics using dietary and anthropometric features. Faith’s PD showed the highest predictability (median ROC AUC ~0.75), followed by Shannon diversity and richness (number of observed microbiota features), shown in Supplementary Fig. 3A. In other words, microbial composition strongly predicts dietary patterns, which was also demonstrated in recent studies8,21, while dietary patterns also demonstrate robust, albeit slightly lower, predictive power in the opposite direction.
Analysis of feature importance for the best performing dietary classifiers (HEI, vegetables-fruits, oil-nuts, coffee, and meat) revealed shared predictive taxa (Fig. 4C). Members of the Lachnospiraceae family, particularly Eubacterium, Lachnospira, and Butyribacter, were important predictors for HEI, vegetables-fruits and oil-nuts. For meat consumption, important predictors included Mediterraneibacter and Coprococcus (Lachnospiraceae), along with Blautia, Negativibacillus (Ruminococcaceae), several Bacilli, Bilophila and Allisonella genus. Coffee consumption was best predicted by Lawsonibacter, Massilioclostridium and members of Coriobacteriia and Bacteroidia.
When predicting alpha diversity metrics from dietary and lifestyle factors, daily HEI emerged as the strongest predictor across all four diversity metrics, followed by age and potassium intake (Supplementary Fig. 3B). Notably, several metrics of dietary variability (CV) ranked among the top predictive features, particularly CV of vegetables, HEI, and fruits. The prominence of these CV features in predicting alpha diversity provides independent support for our observation that both diet quality and its temporal consistency play key roles in shaping the gut microbiome composition.
Stool quality linked to diet quality, diversity, and regularity
In the “Food & You” cohort, participants filled daily questionnaires, including optional stool quality reports, with 140 participants reporting for at least 5 days. Stool quality was categorized as normal, great, constipated, or diarrhea. We derived two features: great stool proportion, denoting the proportion of days reported as great, and diarrhea proportion, denoting the proportion of days reported as diarrhea.
Figure 5A shows the factors correlating with great-quality stool proportion. Coffee consumption showed the strongest positive correlation, followed by dairy, mean dietary diversity score (DDS), and CValcohol, with Spearman correlations ranging from r = 0.2 to 0.3. Certain micronutrients (such as calcium, phosphorus, and folate), along with saturated fatty acids and diet indexes (HEI and dietary Shannon diversity), showed positive correlations between r = 0.15 and r = 0.2. Sugary foods and fast foods demonstrated negative correlations (r = −0.22 and r = −0.15, respectively). Several CV factors, including CVdairy, CVphosphorus, CVfruits, CVcalcium, and CVoils-nuts, negatively correlated with great stool quality. Lifestyle factors such as stress levels, screen hours, and sleeping problems also showed negative correlations. Notably, for many dietary features, the correlation of irregularity with great stool was stronger than that of the feature’s quantity.
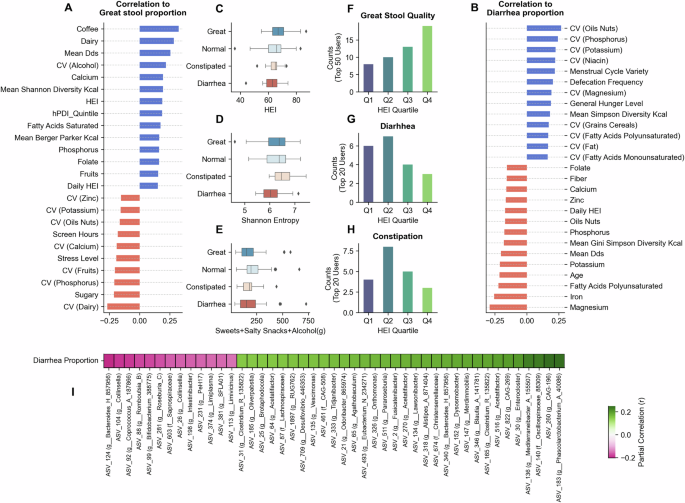
A, B Represents the Spearman correlation (greater than ±0.15) of different factors to proportions of self-reported “great stool quality” proportion and diarrhea proportions, respectively. C–E Highlight the distributions of HEI, Shannon diversity, and sweet-salty snacks-alcohol consumption across top users grouped by stool quality: diarrhea (n = 20), constipated (n = 17), normal (n = 61), and great (n = 43). Boxplots display the median (line), interquartile range (box) and whiskers extending to 1.5× IQR. F–H Highlight the HEI quartile proportions for groups of individuals with different self-reported stool qualities. I Shows the heatmap highlighting the partial correlation of the most correlated bacteria (positive and negative) to the diarrhea proportion observed in users.
For diarrhea proportion (Fig. 5B), irregular intakes of different food groups and nutrients (CVoils-nuts, CVphosphorus, CVpotassium, CVgrains-cereals, CVniacin) showed positive associations. Defecation frequency, menstrual cycle variety, and general hunger level also positively correlated with diarrhea proportion. Micronutrient intakes (for magnesium, iron, potassium, phosphorus, zinc, calcium) and polyunsaturated fatty acids showed negative correlations (r = −0.15 to −0.28). Dietary indices, including mean DDS, HEI, and Gini Simpson Diversity scores, also negatively correlated with diarrhea proportions.
We classified users based on stool quality proportions: the top 50 users with the highest great quality as great, the top 20 users with the highest constipated and diarrhea proportions as constipated and diarrhea, respectively, and the remainder as normal. Users with great stool quality showed higher occurrences of high HEI quartiles Q4 and Q3 (Fig. 5F), while diarrhea users showed the opposite trend (Fig. 5G) and lower Shannon alpha diversity (Fig. 5D). Constipated users showed no linear trend with the HEI, with most users having either above-average (Q3) or poor (Q1) diet quality.
Partial correlation analysis, controlling for age and BMI, revealed associations between microbial taxa and diarrhea proportion (Fig. 5I). Genera including Mediterraneibacter_A_155507 (ASV 136), Phascolarctobacterium_A (ASV 183), Acetatifactor (ASVs 516 and 270), Bacteroides_H (ASV 340), Lawsonibacter (ASV 134), Dysosmobacter (ASV_152), Clostridium_Q_135822 (ASV 165 and 31) showed highest positive correlations. Conversely, ASVs corresponding to Bifidobacterium_388775 (ASV 99), Bacteroides_H (ASV 124), Coprococcus_A_187866 (ASV 92), and Collinsella (ASVs 104 and 26), demonstrated weak negative correlations (around r = −0.2).
link


